Overview
VideoRay control software and other related applications can use charts to aid in mission planning and navigation. These applications require a geo-referenced file that includes coordinates and scaling information. This document provides information on how to create and use these geo-referenced charts.
Creating Charts
Several tools are available for creating charts. This document is not intended to be comprehensive list of all possible options.
SAT2CHART (free)
Global Mapper (available for purchase)
![]() For most users, the free versions will be sufficient for their applications. For those requiring increased accuracy and higher image resolution, the programs available for purchase may be more suitable for specific applications. It is recommended that you try the free version first and decide whether these meet your needs. If not, you can explore the other options. Some of the programs available for purchase include a free evaluation period.
For most users, the free versions will be sufficient for their applications. For those requiring increased accuracy and higher image resolution, the programs available for purchase may be more suitable for specific applications. It is recommended that you try the free version first and decide whether these meet your needs. If not, you can explore the other options. Some of the programs available for purchase include a free evaluation period.
Other Sources of Charts
- Reference list of multiple free chart sources from OpenCPN.
- NOAA (National Oceanic and Atmospheric Administration) USA Coastal Regions
- Kystinfo European Regions
Using Charts in Greensea
After creating your chart, copy it to the desired folder on the Operator Control Console.
![]() If you are going to be making charts on a regular basis, you should create a base folder called “charts” or something similar. You can create project folders within your charts folder to help keep your charts organized.
If you are going to be making charts on a regular basis, you should create a base folder called “charts” or something similar. You can create project folders within your charts folder to help keep your charts organized.
Procedures
- Start the Greensea software.
- Make sure the Map view is available (using F1 or F4).

- Select the Map Config tab from the tabs under the map area.
- Select the Charts sub-tab on the left.
- Use one of the following methods to load the chart.
- Method 1
- Click on the “Import File (or drag and drop file onto map)” button.
- Browse to the desired file location.
- Select the desired file and click the Open button.

- Method 2
- Open a File Explorer window.
- Navigate to find your chart file.
- Drag and drop the chart file from the File Explorer window onto the map area.
- Method 1
- The map area will automatically zoom to the newly loaded chart.
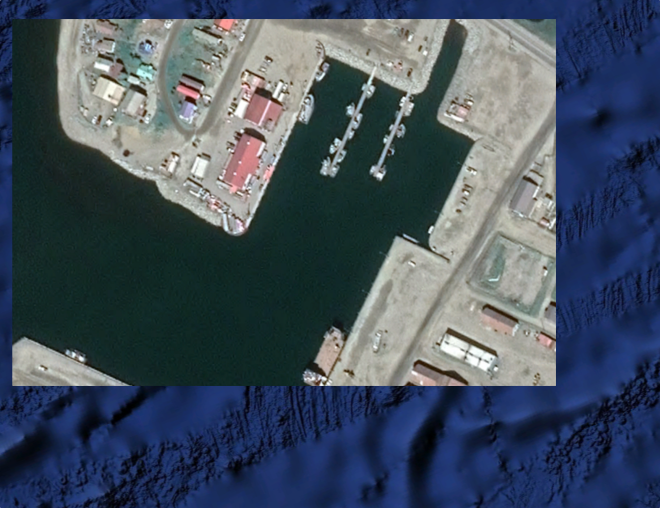
![]() You can load more than one chart, such as aerial and bathymetric views of the same area. You can also change the opacity of each chart. Reducing the opacity can help with sonar image analysis and interpretation.
You can load more than one chart, such as aerial and bathymetric views of the same area. You can also change the opacity of each chart. Reducing the opacity can help with sonar image analysis and interpretation.